Appearance
Visualization Scheme
Representation of Variation: Graph Tracks
Each indivdual chromosome/scaffold/contig sequence (aka graph path) is shown in one row as a track. In the single-bp zoom level, a pangenome sequence is shown on top, which is the concatenation of all sequences in the graph and thus contains all variation in the samples.
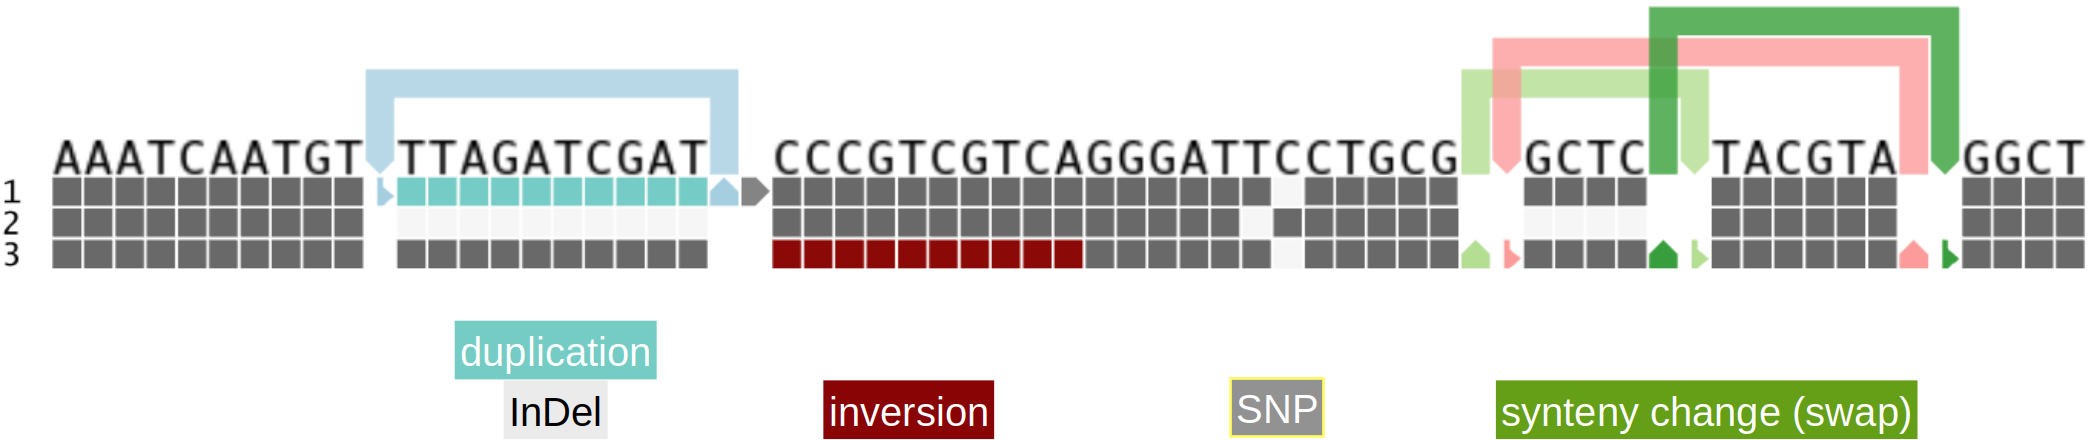
Due to the presence/absence representation, a single nucleotide polymorphism (SNP) is represented in two consecutive columns; filled column indicates the presence, blank column the absence of the sequence.
Different kinds of variation can be represented with colors:
- duplicated regions are colored in shades of turquoise based on the number of traversals of the respective sequences in the graph
- inverted regions are denoted with a small band in shades of red on top of each track; such regions must be read from left to right
Variation that cannot be represented in the linear matrix scheme is displayed by 'links'. Arrows pointing upwards indicate to continue reading the path's sequence at the other end of the link and in the direction of the small 'landing arrow'. By right clicking on a link column and selecting 'Follow link', the user can navigate to the other end of the link. Links next to each other are traversed in the order they are shown. Numbers in links indicate the path of consecutive traversals.
TIP
A legend can be opened anytime in a popup to explain the colors of the tracks; click on the info icon in the Toolbar.
Gene Annotations
Available gene annotations for individual graph paths are overlaid in blue bands at the bottom of each track, with the following color scheme:
- Exons: dark blue
- Introns: light blue
- Reverse oriented genes have darker blue colors than forward oriented genes
Zoom levels / Bin Widths
Pantograph supports pre-computed zoom levels known as "bin widths", where each column (or 'bin') contains a defined number of consecutive bases in the pangenome sequence. The tool displays the fraction of bases covered in each column through tooltips over the track's cells (Cov). The grey shade of the cell visually represents the coverage value, ranging from white (coverage 0: no sequence in the column is present in the track) to dark grey (coverage 1: all bases in the column are present in the track). The Inv value denotes the fraction of covered sequence that is inverted in the column of the path, i.e. that is traversed from right to left.
For example, if a bin width of 100 is selected, each column in Pantograph represents 100 consecutive bases in the sorted pangenome sequence. If the coverage value (indicated as 'cov' in the tooltip) is 0.7, it means that 70 of the 100 bases in that column are covered in the selected path. The 'inv' value indicates the fraction of the 70 bases that are inverted.
Zoom levels can be changed by the dropdown "Bin width" in the Toolbar, or via the right-click menu on any column.
Variant Tracks
Any variant data obtained from re-sequencing, targeted sequencing, or genotyping can be seamlessly integrated into Pantograph, provided the reference genome used is included in the pangenome graph. Variants for each sample are displayed as a single variant track, with variant sites highlighted in the corresponding columns of the reference genome track.
Color scheme:
- Variant Density: For cells containing multiple variants, the number of variants is represented by shades of green (the darker the more variants).
- Color by genotype: If there is only a single variant in the column, cells are colored in shades of violet to represent the genotypes: the darker the color the more alternative alleles.
Variant tracks can be sorted by genotypes in a specific column by right-clicking the desired column and selecting "Sort variant tracks."
Tooltips on variant tracks show information about the number of variants and SVs larger than 50bp, or information about each variant, if less than 5 variants are within the column. It includes the coordinate on the reference genome, the called genotype ('GT'), the reference ('Ref') and alternative alleles ('Alt') or their lengths only (if too long to display), as well as comma-separated read coverages for these alleles ('covs').
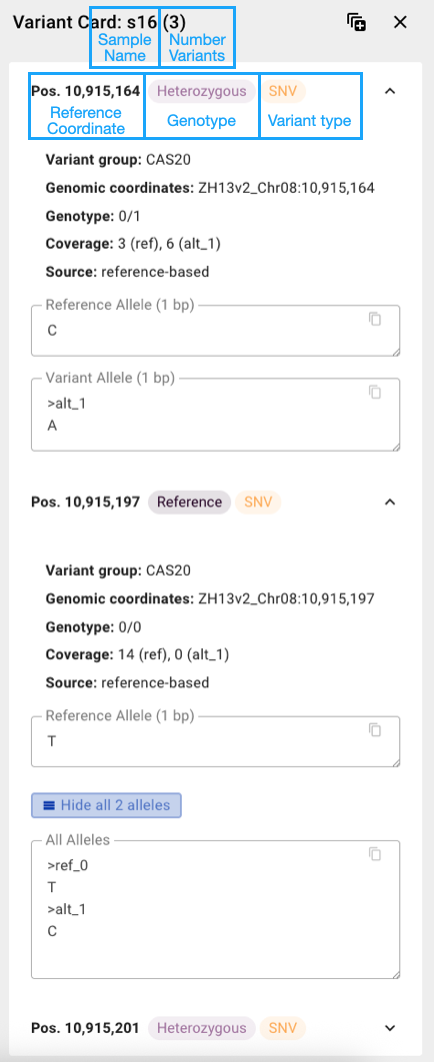
Variant Card
Clicking on a cell with less than 10 variants displays detailed variant information in a Variant Card. For cells with more variants, only the number of variants and SVs (longer than 50bp) is shown.
Summary variant tracks
Variant tracks with a small green circle indicate 'summary variant tracks'. They represent multiple samples and show their variant call and genotype frequencies.
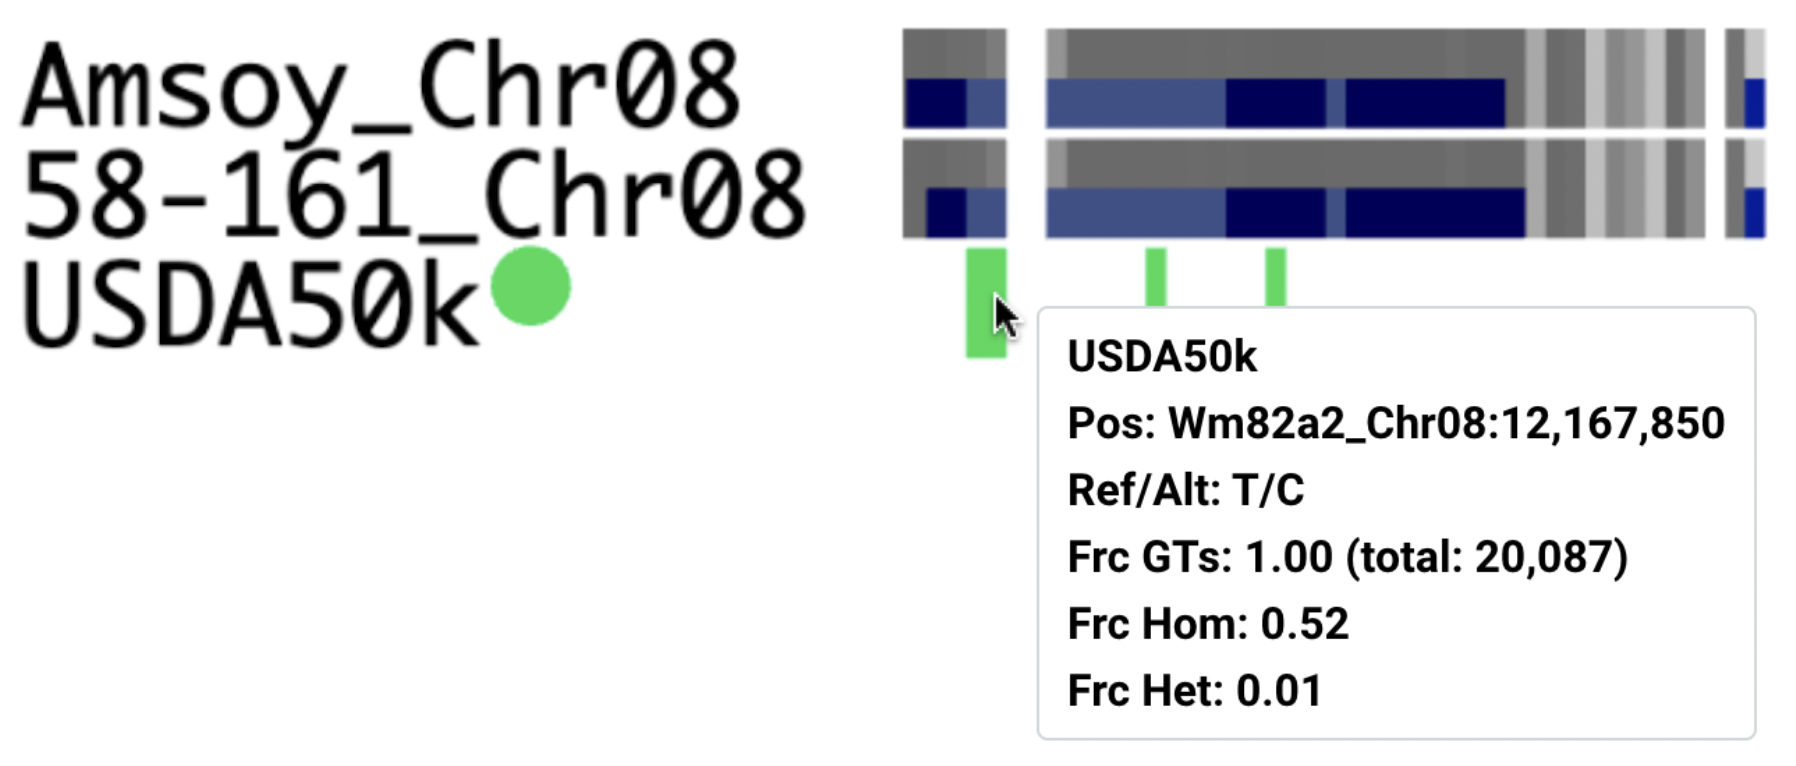
Summarized variant tracks show the following information:
- Pos: Genomic coordinate relative to the reference genome
- Ref/Alt: reference and alternative allele
- GT (individual tracks): Genotype of variant call (0: reference call, 1: heterozygous, 2: homozygous alternative)
- Frc GTs (summary tracks): fraction of samples with information = covered samples (from
total:number of samples) - Frc Hom (summary tracks): fraction of covered samples with homozygous alternative allele
- Frc Het (summary tracks): fraction of covered samples with heterozygous allele