Appearance
Graph View
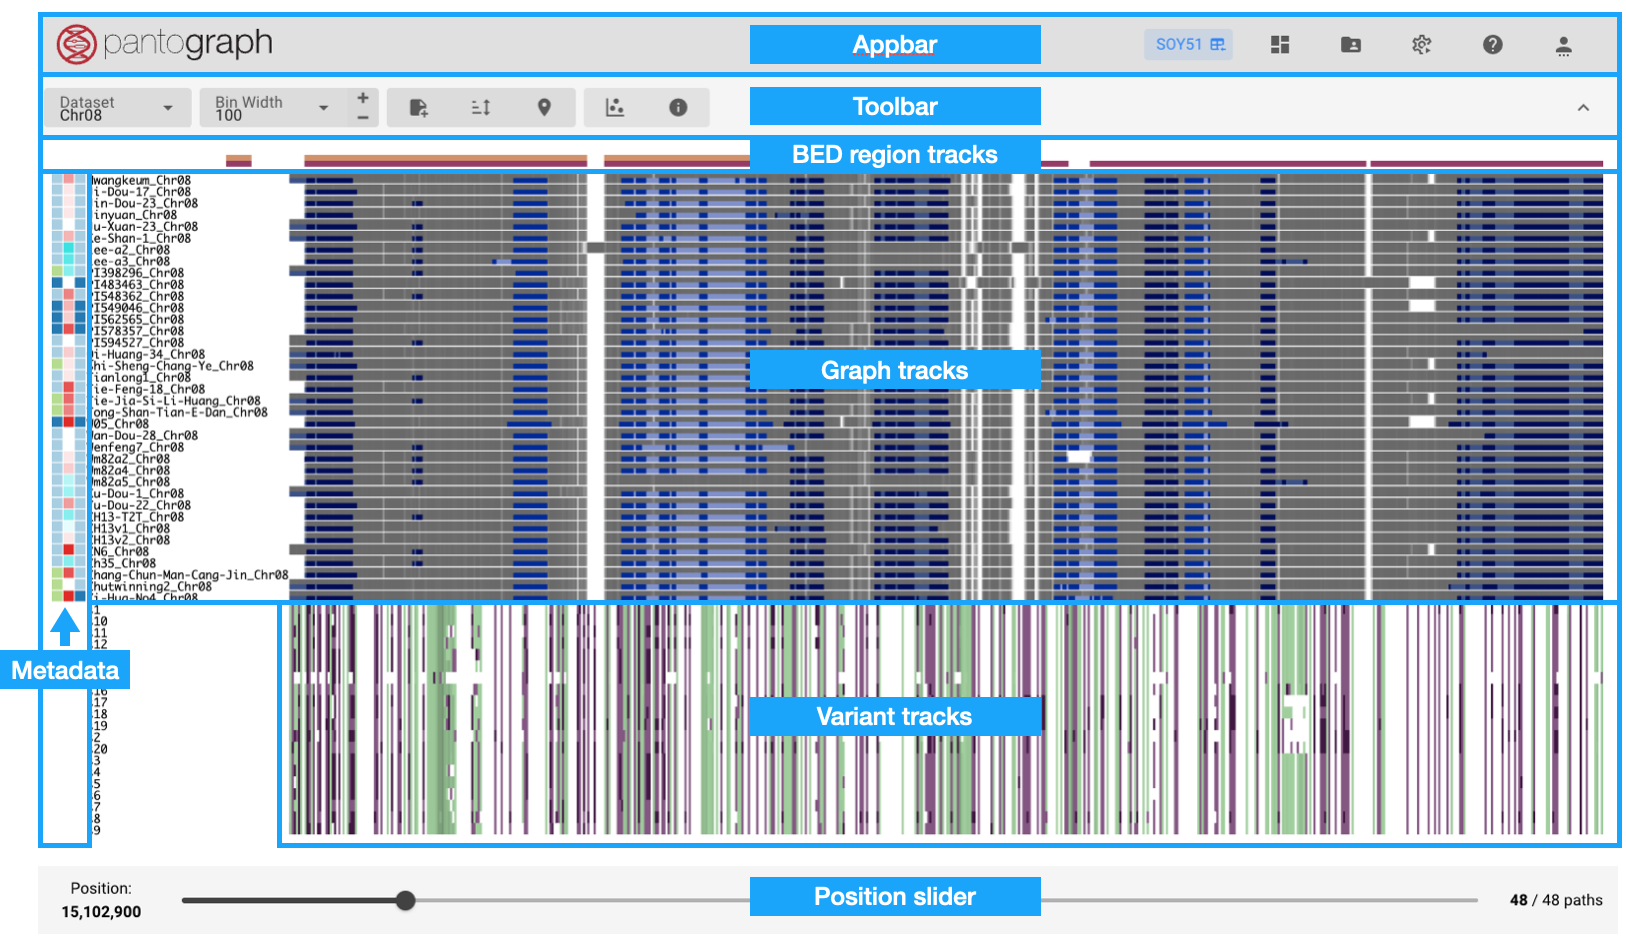
This page displays the chromosome-specific pangenome graph. It is divided into following parts:
- Pantograph logo: clicking opens the Genome View
- Appbar
- Toolbar
- Tracks: Graph, variant, and BED region/QTL tracks
- Metadata heatmaps
- Position slider: start position of the current view in the pangenome graph
Appbar
The following pages can be accessed in the appbar on the very top of the page:

Toolbar
The toolbar offers these functionalities from left to right:

Dataset: navigate to a chromosome-specific pangenome graph
Bin width: select the zoom level
Tracks menu: (de)select tracks (graph, variant, and BED region tracks) and metadata Sort Menu: sort graph and variant tracks separately by metadata values or by name, in ascending or descending order Navigation Menu: navigate to genome-specific coordinates or to genes by name (partial match) Plot Menu:- Interactive PCA plot (if available)
- Tree Window to browse cluster dendrograms or pre-computed phylogenetic trees
Tracks
There are three different kind of tracks:
- Graph tracks: Show the aligned genomic sequences from the pangenome graph
- Variant tracks: Show variant calls from vcf files anchored to paths in the pangenome
- BED region tracks: Show provided BED regions along the pangenome (typically QTL regions)
Metadata
Any available meta data associated with each path is displayed as one vertical heatmap per meta data category in front of each row. Meta data can be traits like flowering time, maturity, yield, etc., a haplotype identifier or other categories (e.g. cultivation type, provenance). Categorical as well as quantitative (integer or floating point numbers) are supported and automatically identified.
Tracks can be sorted by metadata categories via the dropdown menu in the toolbar or by clicking small arrows on top of each metadata heatmap. Each repeated click reverts the sort order.
Metadata can be uploaded/updated by admin users.